In many ways, the AIM enhancements turn buyer and inventory managers into data managers. For the calculations to work most effectively, they must have excellent data feeding the replenishment calculations, and it’s the responsibility of the entire organization to ensure the data is accurate and complete. The buyer’s first job is to review and update the data so it yields the best results.
There are 3 basic numbers that feed the replenishment calculations: Usage, Lead Time, Review Cycle.
From these three basic values, we develop the replenishment controls for each item. These values are updated daily by FACTS background processor programs that you schedule typically to be run after hours. Having these values updated daily allows FACTS to very quickly respond to changes in sales.
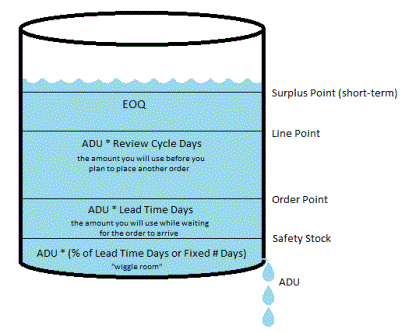
Picture each item in a warehouse as a bucket. The water in the bucket is your inventory. There is a hole in the bottom of the bucket allowing water to escape. The rate at which the water escapes is your usage. The levels in the bucket illustrate the replenishment values:

Average Daily Usage (ADU) is calculated from the usage data and represents what we should expect to sell, on average, of the item today.
In the diagram, the next value above safety stock is Order Point (OP). Building from order point, we get to Line Point (LP). Safety Stock (SS) is the first, base stock value.
The above three values, Safety Stock, Order Point and Line Point, build on each other. If safety stock changes, it impacts both OP and LP. If OP changes, it also changes LP. If ADU changes, it impacts all of them. If lead time changes, it will impact potentially safety stock, and it will impact OP, which then changes LP. Review cycle only impacts LP.
When issues occur with the calculated replenishment values, it’s important to understand the relationship between these numbers so you can determine the best way to address the issues and get the results you want.
For example, if you change ADU, the final impact to LP will be significant because it factors into each of the other values, whereas changing order point will not impact safety stock.
The economic order quantity (EOQ) is used to optimize the order quantity based on the cost to place an order vs. the cost to carry the item.
There are multiple ways to adjust or limit the values above. Each can be used to address different issues with the calculated values. Most of the values require expiration dates. It is good practice to set the expiration dates to reasonable lengths of time and to enter memos with each to remind you why the value was originally entered.
There are two major categories for adjusters and fences: Usage Adjusters and Fences and Order Point Adjusters. Additional methods to adjust or limit the values in the diagram include Rank Adjusters and Parameters, Order Quantity Minimums and Rounding Values, Lead Time Adjusters and General Settings, and Safety Stock Parameters and Adjusters.